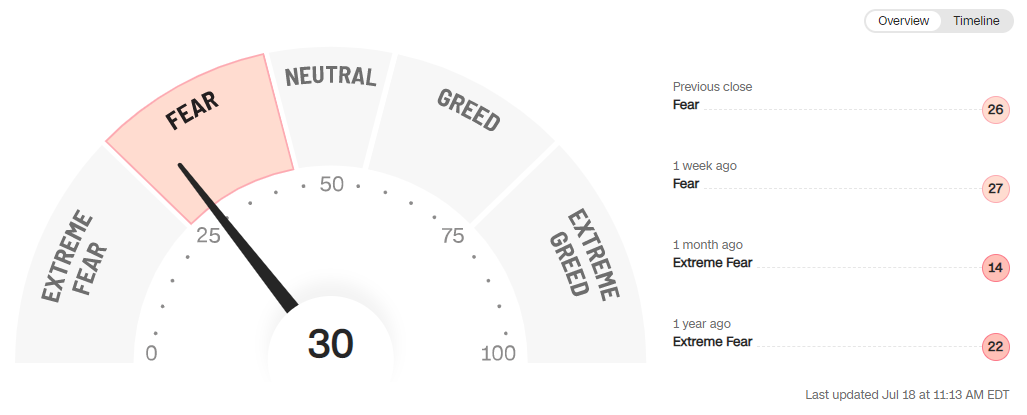
For months now, we've been sending out newsletters with effectively the same message. "Don't worry, this too will pass", "Invest through the bumps", etc. We know that emotions are stacking and we know that it's tough to watch an account decrease in value in what seems to be month after month.
Every client has heard this all before. You hear that the markets go up and down and that you should invest through it and you know that the best time to buy equities are when markets are down. So why is it so hard? While everyone has their own reasons, it basically boils down to one thing... It's your hard-earned cash!
As advisors we are cognizant of that fact and it is front and center when we are helping setup portfolios for clients. Unfortunately, every 10-15 years the markets go haywire and there is just nothing that can be done. Unfortunately, many take the approach to slow down their contributions, sell their equities and wait in cash or some combination of the two. Actually, many studies have shown that is the exact opposite of what you are supposed to do. As I have quoted before, in my opinion Warren Buffet said it best... "Be fearful when others are greedy, but be greedy when others are fearful!"
Let's talk emotions...
CNN has an index which effectively indicates the emotional state of investors. Currently, it is indicating that the market is still fearful for the future, which according to Warren Buffet means is a good time to put capital to work. Now, this is an oversimplification of his statement, but the point is that when things are scary, that's the time that you should be increasing your risk, contributions, etc.
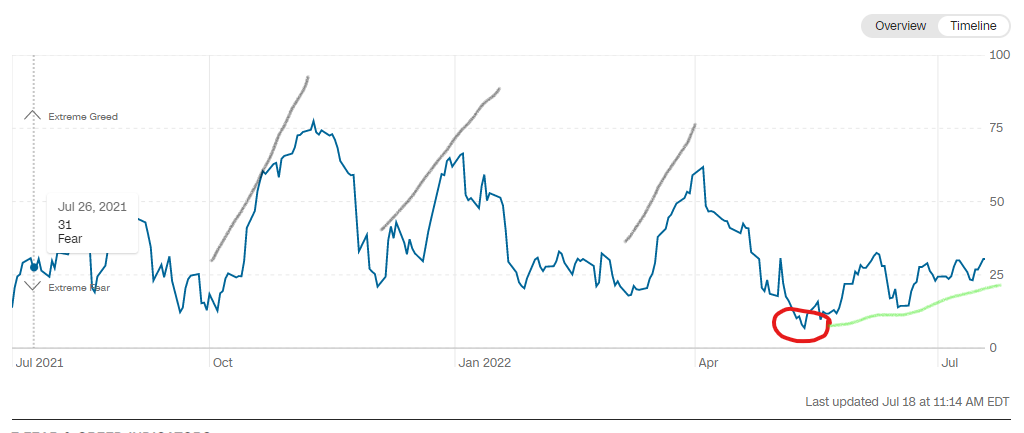
in addition to the image above, CNN also offers a timeline version of this, so you can see how it has looked over the past year. I find it interesting (and promising) that each rally that we have seen in this bear market has been met with a rapidly increasing greed level. Meaning, the market started to rise and people just started piling back into the market without thinking. This led to further declines which I suspect is because it was not a gradual increase.
If you look at the timeline below, you will see that the rallies that happened in October, December and again in March were all very sharp, increasing in the greed levels. However, in May we hit a new Extreme Fear level in which there was a gradual climb since then. Over the last couple of trading days (Friday July 15 & Monday July 18) we have seen fairly strong markets but only gradual increases in the greed index. Again, I find this very promising that maybe the worst is behind us (I'm not making a prediction -- just observing in hope).
So what should you do?
Unfortunately, this is where the message stays the same... If you are a long term investor, then NOTHING! If you're close to (or in) retirement, then employing strategies like dividends, cash wedges, etc. will help you to weather the storm. If you're still in your accumulation years, then now is a great time to review your budget and see if you can increase your contributions.
The tough part is that for many these market opportunities come at bad times. Increase rates, inflation or even economic slowdowns can all have a negative impact on cash flow which can restrict the ability to take advantage and invest more. So, the next best thing is to stay the course.
History doesn't guarantee anything, but markets recover. Sometimes six months down the line, sometimes one year or three years. But, eventually, markets recover and those that held their course tend to be better off than those that were fearful and tried to stop the pain by selling to cash, or something similar.
JP Morgan Asset Management created a great article on this: https://am.jpmorgan.com/us/en/asset-management/adv/insights/market-insights/market-updates/on-the-minds-of-investors/should-i-time-the-bottom-in-todays-market/
A strategy to reduce volatility, increase comfort and take advantage of market opportunities
As already mentioned, it's tough. It's emotionally difficult to put new money to work in what looks like a sinking ship. That said, it really is best to stick to your plan through good times and bad. One way you can do this is by dollar-cost-averaging. Constant monthly (or biweekly) contributions can benefit your account a lot. Making constant contributions, allows you to accumulate more shares (or units) when markets go down. When markets recover you end up being higher than it would have been previously because now you have more shares.
The same is true if you have a lump sum of money to invest. Instead of dumping it all in at once, consider cutting it up over 3-4 months and do regular intervals of purchases. This helps reduce the risk of buying at the wrong time and gives some piece of mind that you are investing over time.
So how long will this last?
While no one can say for certain how long a bear market will last, but we can look at history for guidance. There is a good article here discussing the length of bear markets.
We'll ignore the Great Depression since that was almost 100 years ago and likely not the same situation. For the most part, the broad-based indexes that are NOT technology focused (so the S&P & Dow Jones) tend to recover in about 12-24 months. The NASDAQ being technology focused tends to take a bit longer to recover from bear markets (36-48 months). That said, as far as bear markets go, this one has had stocks pulling back and repricing but it seems to be driven by inflation. While stocks reprice due to these factors, markets still tend to go up during these periods of uncertainty.
If we look back to the 1970's, there seems to be a lot of media outlets referencing the 70's right now with inflation. If you invested $10,000 at the beginning of 1970 in a well diversified portfolio consisting of 30% Canadian Bonds, 35% Canadian Equities, 25% U.S. Equities and 10% EAFE Equities (Europe, Asia & Far East) you would have had $25,122 10 years later. If you held that same portfolio for the following 10 years you would have ended up $103,596. That's 2.5x your initial investment 10 years later and 10x your initial investment 20 years later.
We don't know if the next 10 years will result in the same kind of return, but history has shown that if we try and time the market, we'll likely lose out and if we just buckle up and ride the bumps we should do well.
Disclaimer: For illustrative purposes only. The rate of return shown is used only to illustrate the effects of the compound growth rate and is not intended to reflect future values of the investments


